

Fair Value Gaps (FVG) Explained: Definition, Types & Strategy
A fair value gap is a three-candle price imbalance where the market moved too fast to fill resting orders. Learn what FVGs are, how to find them, and how to trade them.

A fair value gap (FVG) is a three-candle pattern where price moves so quickly in one direction that a gap in filled orders is left behind. These gaps mark imbalance zones that price often returns to revisit. A bullish FVG acts as potential support on a retest. A bearish FVG acts as potential resistance.
Fair value gaps were popularized by ICT (Inner Circle Trader) and are widely used by SMC-based price action traders. This article covers what FVGs are, how to identify them, how to trade them, and the market theory behind them.
What Is a Fair Value Gap (FVG)?
A fair value gap is an area on a chart where price moved so fast that the candles on either side of the move failed to overlap. That gap represents an imbalance: orders that went unfilled because the market moved through the zone without giving enough time for buyers and sellers to fully transact.
A bullish FVG forms during a sharp upward move and acts as support on a retest. A bearish FVG forms during a sharp downward move and acts as resistance on a retest. When price returns to the zone, the remaining unfilled orders are absorbed and the market often reverses in the original direction.
If price later breaks through an FVG rather than respecting it, the gap can convert into an inversion fair value gap (IFVG), where the zone flips and plays the opposite role.
How to Identify an FVG
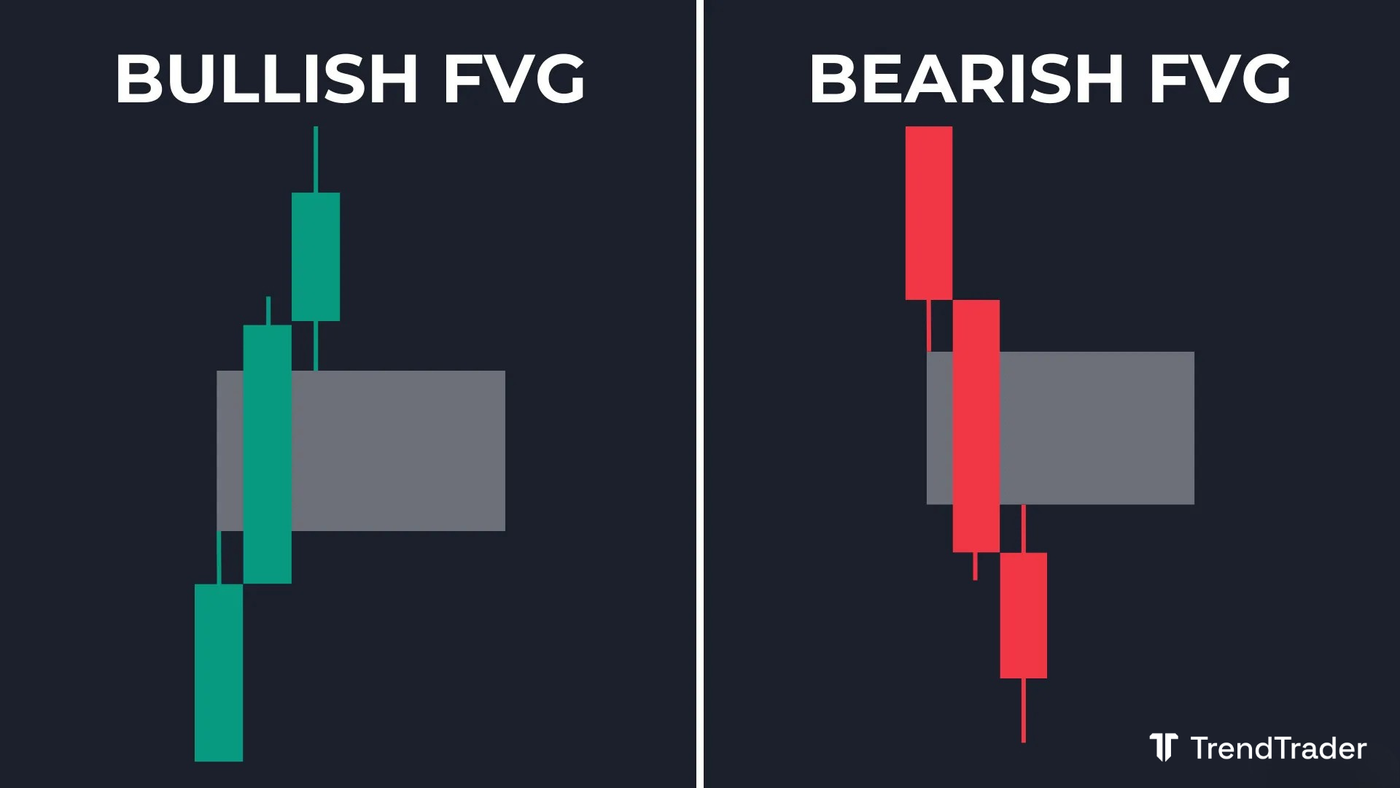
FVGs are a three-candle pattern. The middle candle must be large relative to the candles on either side. The wick of the first candle and the wick of the third candle must not overlap. The space between those wicks is the fair value gap.
How to Find a Bullish FVG
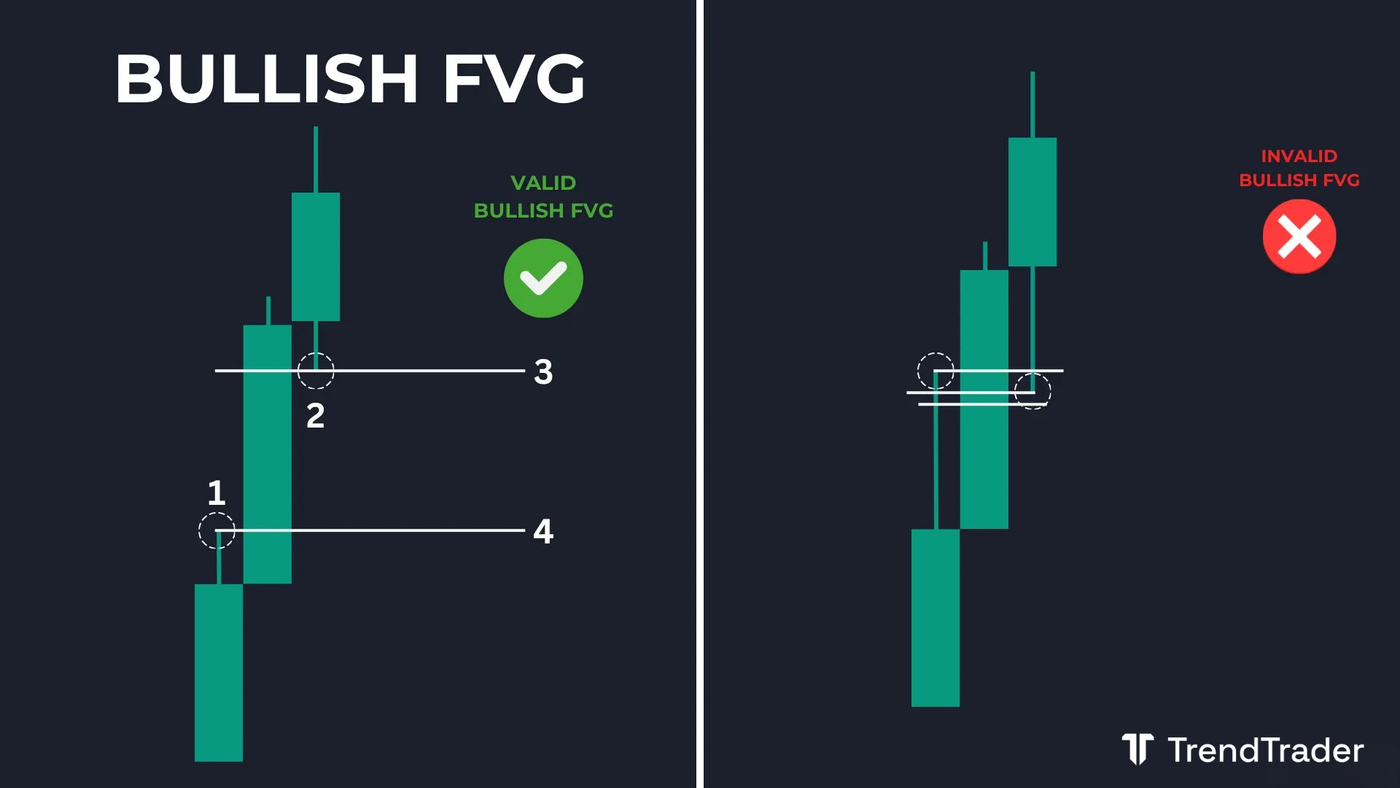
Look for a large bullish (green) candle significantly bigger than the candles on its left and right. The high of the left candle must not overlap with the low of the right candle. Draw your zone from the high of the left candle (bottom of the zone) to the low of the right candle (top of the zone), and extend it forward on your chart.
When price retraces into this zone, watch for support and a push back upward. If price closes below the bottom of the bullish FVG zone, the gap is invalidated and should no longer be used.
How to Find a Bearish FVG
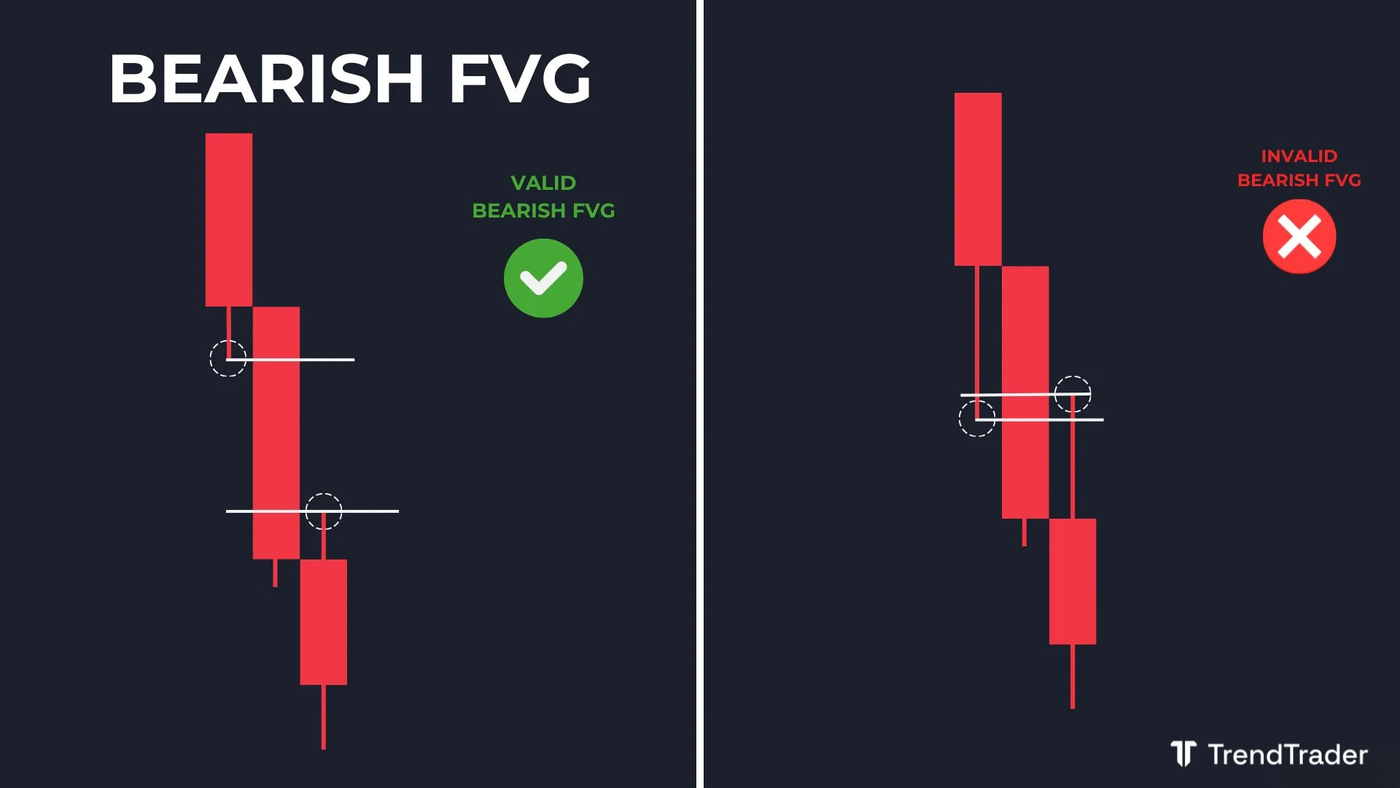
Look for a large bearish (red) candle significantly bigger than the candles on its left and right. The low of the left candle must not overlap with the high of the right candle. Draw your zone from the low of the left candle (top of the zone) to the high of the right candle (bottom of the zone), and extend it forward.
When price rises into this zone, watch for resistance and a push back downward. If price closes above the top of the bearish FVG zone, the gap is invalidated and should no longer be used.
What Is the Theory Behind FVGs?
The logic comes from how large institutional orders move markets. A sudden spike in price typically reflects a large order being executed. When price moves sharply and does not retrace, the participants who triggered the move are still holding and willing to transact at the new level. That shift changes the perceived fair value of the asset.
A concrete example: a stock is trading between $9 and $10. News is released and it jumps to $11. Traders who bought at $9 continue to hold because they expect higher prices. The market's fair value has shifted to $10-11. If price later retraces into that zone, buyers step back in at what they now consider a reasonable price, driving it back up.
The wick of the candle to the left of the large spike marks the bottom of the new fair value zone. The wick of the candle to the right marks the top. If those two wicks overlap, the move was not strong enough to establish a new fair value and the FVG is invalid.
What Timeframes Are Best for Fair Value Gaps?
FVGs work across all timeframes. Intraday timeframes (1-minute, 5-minute, 15-minute) produce them frequently. Higher timeframes produce fewer but more durable gaps.
As with order blocks, higher timeframe FVGs carry more weight because more participants are reacting to them. A five-minute FVG may fill within minutes. A daily FVG can stay open for weeks.
Top-down analysis is the practical approach: identify a significant FVG on a higher timeframe, then drop to a lower timeframe to time your entry at the zone.
What Markets Do Fair Value Gaps Work In?
Fair value gaps work in any liquid market: stocks, crypto, forex, and futures. The pattern relies on fast impulsive moves driven by large order flow, so high-volume instruments produce the most reliable gaps.
Major indices, large-cap crypto, and major forex pairs all produce clear FVGs regularly. Thinly traded instruments can show patterns that look like FVGs but lack the institutional order flow needed to make them consistently meaningful.
How Accurate Are Fair Value Gaps?
FVGs form quickly, which means they are plentiful on any chart. That speed is both an advantage and a limitation. Not every FVG produces a reaction, and gaps in thinly traded markets or on very low timeframes tend to be less reliable.
The most consistent approach is to combine FVGs with additional confluence: a liquidity grab near the zone, an order block or breaker block at the same level, or a clear higher-timeframe trend aligned with your entry direction. An FVG gives you the location. Confluence is what makes it a trade worth taking.
This article is for educational purposes only and does not constitute financial advice. Trading involves significant risk of loss. Do your own research and consult a licensed financial advisor before making any trading decisions.
Browse more trading concept guides on the TrendTrader blog.
